This is the multi-page printable view of this section. Click here to print.
News
Beginner's Guide to Hyperfoil: part 3
In this article we’ll show how to run Hyperfoil inside an Openshift cluster, benchmarking workload within the same cluster. This assumes that you have sufficient privileges to install operators and create new namespaces (projects).
Demo workload
We will install Vehicle Market, our demo application we’ve used in the first article using console and Openshift Template.
Login into your cluster and run this:
# Fetch the default domain your cluster uses
export DOMAIN=$(oc get ingresscontrollers.operator.openshift.io \
    -n openshift-ingress-operator default -o jsonpath='{ .status.domain }')
oc new-project vehicle-market
curl -Ls http://vehicle-market-template.hyperfoil.io | \
    oc process -f - -p DOMAIN=vehicle-market.$DOMAIN | oc apply -f -
echo http://vehicle-market.$DOMAIN
This will deploy 5 pods, 5 services and 4 routes in the vehicle-market namespace, and load some example data. You can open the URL printed as the last line in your browser and explore the application.
Installing Hyperfoil
You can install Hyperfoil Operator either through web-console, or on command-line using oc. For the web-console installation switch to the ‘Administrator view’ and go to Operators/OperatorHub. Filter ‘Hyperfoil’ and you should see the operator:
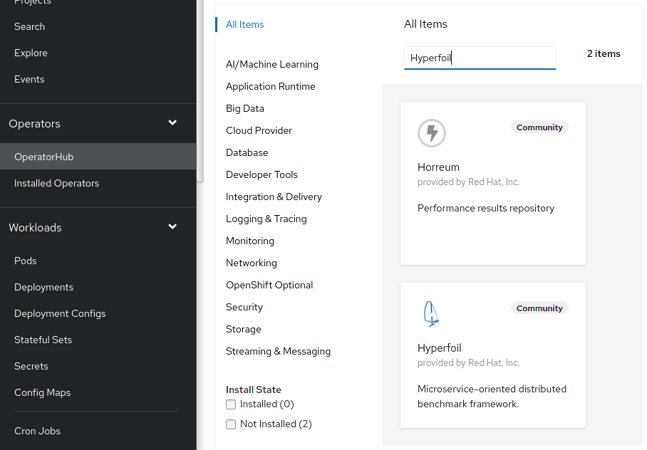
Click on Hyperfoil and go through the wizard with all settings on default values (install to all namespaces with automatic approval).
Alternatively you can create the subscription by defining this subscription:
apiVersion: operators.coreos.com/v1alpha1
kind: Subscription
metadata:
  name: hyperfoil-operator
  namespace: openshift-operators
spec:
  channel: alpha
  name: hyperfoil-bundle
  source: community-operators
  sourceNamespace: openshift-marketplace
In any case you should end up with Hyperfoil listed amongst the installed operators:

Now you can create a new namespace for Hyperfoil and add the custom resource. In web-console open the dropdown on top and create a new namespace hyperfoil. When the page reloads with all operators (that can take a couple of seconds) click on ‘Hyperfoil’ in the Provided APIs column (highlighted with red ellipse above). Press the ‘Create Hyperfoil’ button on the right side and switch to YAML View, filling the definition below and push ‘Create’ button below the editor.
apiVersion: hyperfoil.io/v1alpha2
kind: Hyperfoil
metadata:
  name: hyperfoil
spec:
  route:
    host: hyperfoil.apps.your.domain.com
The only non-default value in this example is the hostname for the route; default hostname would be probably a bit longer. By default the route uses edge termination (the TLS connection is terminated at the router, the communication inside cluster is not encrypted). Therefore we will be connecting to port 443.
On command line just use commands below, passing the CR above as hyperfoil.yaml.
$ oc new-project hyperfoil
$ oc apply -f hyperfoil.yaml
$ oc get hf
NAME        VERSION   ROUTE                            PVC   STATUS
hyperfoil             hyperfoil.apps.your.domain.com         Ready
Using Hyperfoil
Now it’s time to open CLI as we’ve done in the previous articles:
export VMB=$HOME/vehicle-market/benchmarks
podman run -it --rm -v $VMB:/benchmarks:Z -v /tmp/reports:/tmp/reports:Z \
    --network=host quay.io/hyperfoil/hyperfoil cli
```sh [hyperfoil]$ connect hyperfoil.apps.your.domain.com:443 ERROR: javax.net.ssl.SSLHandshakeException: Failed to create SSL connection: Failed to create SSL connection: PKIX path building failed: sun.security.provider.certpath.SunCertPathBuilderException: unable to find valid certification path to requested target: PKIX path building failed: sun.security.provider.certpath.SunCertPathBuilderException: unable to find valid certification path to requested target: unable to find valid certification path to requested target Hint: TLS certificate verification might have failed. Use --insecure to disable validation. Failed connecting to hyperfoil.apps.your.domain.com:443 ```
We are connecting to the route on port 443 (you could also use connect https://hyperfoil.apps.your.domain.com or connect hyperfoi.apps.your.domain.com -p 443) but the certificate issued by the router might not be valid if this is not a production cluster. Use --insecure (or -k) in that case:
[hyperfoil]$ connect hyperfoil.apps.ocp.scalelab:443 -k
WARNING: Hyperfoil TLS certificate validity is not checked. Your credentials might get compromised.
Connected!
[hyperfoil@hyperfoil]$ upload /benchmarks/first-benchmark.hf.yaml
Loaded benchmark first-benchmark, uploading...
... done.
[hyperfoil@hyperfoil]$ run
ERROR: Server responded with unexpected code: 403, Forbidden:
Server is started in clustered mode; benchmarks must define agents.
Failed to start benchmark first-benchmark
Oops, what happened now? We have tried to execute the benchmark from Part 1 that worked just fine when executed from start-local. The controller in Openshift is started in a clustered mode, though, and single-vm runs are prohibited. We need to tell Hyperfoil to run this benchmark using an agent - and the controller will spin up another pod that will fire the load.
name: clustered-benchmark
agents:
  agent-one:
  agent-two:
http:
  host: http://vehicle-market.apps.your.domain.com
  sharedConnections: 10
usersPerSec: 10
duration: 120s
scenario:
- fetchIndex:
  - httpRequest:
      GET: /
Besides adding the agents (with empty definition) we have corrected the endpoint hostname and increased duration to 2 minutes. While the benchmark is running you can verify that controller created another pod:
$ oc get pods -n hyperfoil
NAME                   READY   STATUS    RESTARTS   AGE
agent-0001-agent-one   1/1     Running   0          13s
agent-0001-agent-two   1/1     Running   0          13s
hyperfoil-controller   1/1     Running   0          17m
Both the sharedConnections and usersPerSec have been evenly distributed between the two agents; each will use 5 connections and run 5 users per second.
See the agents section documentation for further customization of the agents.
Configuration options such as securing the controller with password, persistence, logging, hooks etc. can be found in the installation guide.
WebCLI
You are already familiar with Hyperfoil CLI but starting it up in Podman might not be the most convenient way (and neither is keeping Hyperfoil distribution locally). There’s an easy solution for that: just use your browser. Since Hyperfoil 0.14 the controller exposes a CLI — let’s navigate to https://hyperfoil.apps.your.domain.com:

This CLI is automatically connected to the controller where it is running and cannot connect to any other controller (the command connect is missing, as well as exit and few other ones). Some commands are altered, e.g. upload cannot accept path on your machine while in browser — type just upload and then press a button that lets you select the benchmark file. edit does not open vi/vim/your favorite editor but displays a Monaco editor inside the browser. export and report cannot take --destination, instead these commands open download dialogue in the browser.
Tips and tricks
http://vehicle-market.apps.your.domain.com is probably resolved to the load balancer that routes the traffic even before Openshift Ingresses. You might want to bypass this component, hitting the Ingresses directly. You can do that by setting addresses for the endpoints manually:
$ oc get po -n openshift-ingress -o wide
NAME                              READY   STATUS    RESTARTS   AGE   IP               NODE        NOMINATED NODE   READINESS GATES
router-default-56b959876c-94x2f   1/1     Running   1          60d   192.168.222.19   worker006   <none>           <none>
router-default-56b959876c-9tqvb   1/1     Running   0          60d   192.168.222.22   worker009   <none>           <none>
http:
  host: http://vehicle-market.apps.your.domain.com
  sharedConnections: 10
  addresses:
  - 192.168.222.19
  - 192.168.222.22
The connections will be randomly assigned to one of those IPs. You can also use bypass ingress completely and target the service directly - addresses can use hostnames and customize the actual port as well:
http:
  host: http://vehicle-market.apps.your.domain.com
  sharedConnections: 10
  addresses:
  - frontend.vehicle-market.svc.cluster.local:8080
Beginner's Guide to Hyperfoil: part 2
This article is intended to be published on other sites, too - therefore it contains introduction to concepts this blog’s readers are probably familiar with.
In the previous part we’ve deployed our demo application (Vehicle Market) and exercised some basic requests against that. In this post we will focus on processing responses and user workflow through the site.
Processing responses
We will start with a benchmark that fetches single random page with an offering, without the HTML resources part for brevity:
name: first-benchmark
http:
  host: http://localhost:8080
  sharedConnections: 10
duration: 10s
usersPerSec: 10
scenario:
- fetchDetails:
  - randomInt:
      min: 1
      max: 100
      toVar: offering
  - httpRequest:
      GET: /offering/${offering}
We have investigated what a browser would do, and found out that this page executes a request against http://localhost:8082/offering/${offering} to fetch a JSON document. Notice the different port 8082: we will need to add another endpoint to the configuration and start selecting the endpoint in httpRequest steps:
name: vehicle-market
http:
- host: http://localhost:8080
  sharedConnections: 10
- host: http://localhost:8082
  sharedConnections: 10
duration: 10s
usersPerSec: 10
scenario:
- fetchWebpage:
  - randomInt:
      min: 1
      max: 100
      toVar: offering
  - httpRequest:
      GET: /offering/${offering}
      authority: localhost:8080
- fetchJson:
  - httpRequest:
      GET: /offering/${offering}
      authority: localhost:8082
We have added the another sequence fetchJson with a second request. When the scenario contains the sequences as a list these are executed in-order; the second sequence is not started until the last step from the previous one completes. While you could keep both requests in one sequence, the sequence name is used as the default name for the metric. Therefore a metric with the same name would be reported twice. Moving the request to its own sequence solves the problem.
After receiving the JSON the script would modify the DOM and add images referenced in the JSON. Let’s replicate that in our benchmark:
name: vehicle-market
http:
- host: http://localhost:8080
  sharedConnections: 10
- host: http://localhost:8082
  sharedConnections: 10
duration: 10s
usersPerSec: 10
scenario:
  orderedSequences:
  - fetchWebpage:
    - randomInt:
        min: 1
        max: 2
        toVar: offering
    - httpRequest:
        GET: /offering/${offering}
        authority: localhost:8080
  - fetchJson:
    - httpRequest:
        GET: /offering/${offering}
        authority: localhost:8082
        handler:
          body:
            json:
              query: .gallery[].url
              toArray: gallery[10]
    - foreach:
        fromVar: gallery
        sequence:   fetchImage
        counterVar: numImages
    - awaitInt:
        var: numImages
        equalTo: 0
  sequences:
  - fetchImage[10]:
    - httpRequest:
        GET: ${ gallery[.] }
        authority: localhost:8080
        sync: false
        handler:
          onCompletion:
            addToInt: numImages--
The scenario does not host a simple list of sequences anymore; we have moved the original sequences under orderedSequences and added another section sequences with sequence fetchImage. The scenario starts with one instance of fetchWebpage, when this completes a single instance of fetchJson is created. There are no fetchImage instances at the beginning - sequences hosts only definitions but does not create any instances. For details see documentation
In the request in fetchJson we have registered a handler for response body; This handler applies the .gallery[].url query and stores the URLs in an array stored in the session variable gallery. This array has 10 slots; as any other resource in Hyperfoil scenario this array is pre-allocated before the benchmark starts. Therefore we need to limit the size - if there are more images than slots the other URLs are simply discarded.
In the second step in fetchJson the gallery array is scanned by the foreach step. For each item in the array this steps creates a new instance of the fetchImage sequence. The [10] next to the sequence name means that there can be at most 10 instances of fetchImage running concurrently. The number of created sequences is then recorded into variable numImages.
In fact the
foreachstep stops scanning the array when it finds an unset slot - gaps in the array are not supported. This is irrelevant for our scenario, though - thetoArrayfills the array from the start without gaps.
The last step in the fetchJson sequence is not necessary for our scenario (it would be complete after downloading all the images) but shows how to synchronize after all the images are retrieved. In the awaitInt step we are blocking the completion of the sequence until numImages drops to zero. The counter is decremented after the response with the image is fully received (onCompletion handler) using action addToInt.
We have not explained the notation gallery[.] in the path template fetching the image yet. The [.] is called sequence-scoped access: addressing an array with current sequence index. When foreach creates new instances of the same sequence each will get a distinct index (lowest available) that it can use to read/write its private data. Indices for different sequences are not coordinated, though.
Login workflow
Now that you know how to process responses, let’s have a look on another very common part of user workflow: authentication. We’d like to simulate user visiting the front page, clicking on the Login button and filing out the credentials, possibly multiple times to simulate fat fingers.
You need to get list of valid user credentials; Vehicle Market holds a copy of these (regular authentication flow uses hashed passwords) and you can get the list running:
curl localhost:8083/user-loader > /tmp/credentials.csv
Here is the benchmark:
name: login
http:
# Frontend
- host: http://localhost:8080
  sharedConnections: 10
# User service
- host: http://localhost:8083
  sharedConnections: 10
duration: 10s
usersPerSec: 10
scenario:
  orderedSequences:
  - fetchIndex:
    - httpRequest:
        GET: /
        authority: localhost:8080
    - randomInt:
        min: 0
        max: 2
        toVar: failedAttempts
    - randomCsvRow:
        file: /tmp/credentials.csv
        removeQuotes: true
        columns:
          0: username
          1: password
  - wrongLogin:
    - breakSequence:
        intCondition:
          fromVar: failedAttempts
          equalTo: 0
        onBreak:
        - newSequence: successfulLogin
    - httpRequest:
        POST: /login
        authority: localhost:8083
        body:
          form:
          - name: username
            fromVar: username
          - name: password
            value: th1sIsMy$EcretPa55W%rD
        handler:
          autoRangeCheck: false
    - addToInt: failedAttempts--
    - nextSequence: wrongLogin
  sequences:
  - successfulLogin:
    - httpRequest:
        POST: /login
        authority: localhost:8083
        body:
          form:
          - name: username
            fromVar: username
          - name: password
            fromVar: password
There’s nothing extraordinary in the first sequence, fetchIndex - we retrieve the landing page and decide if we should provide the correct credentials right away or have 1 or 2 failed attempts. We also select credentials using the randomCsvRow step. This step picks a random row from a CSV-formatted file, and stores the values into variables. In our case we pick the first column (columns are indexed starting from zero) into variable username and second into password.
After this we automatically jump to the wrongLogin sequence (even if we’re not supposed to use wrong credentials). The first step there is the conditional breakSequence step: this step can terminate execution of its sequence prematurely (subsequent steps are not executed) and execute one or more actions. In onBreak we use the newSequence action that creates a new instance of sequence successfulLogin.
If the condition does not hold the execution of wrongLogin continues with the well known httpRequest step. This time we are firing a POST request, with a request body that will simulate a submitted HTML form. Hyperfoil will automatically add the Content-Type: application/x-www-form-urlencoded header and URL-encode the variables should there be any special characters. In this instance we’re using a constant value for the password that should not match any actual user password.
By default Hyperfoil adds handlers that will mark the response as invalid and stop session execution when the response status is not between 200 and 399. We’re expecting a 401 response with invalid credentials and therefore we disable this default behaviour by setting autoRangeCheck: false (we don’t need to disable the other handler, stopOnInvalid). Note that this behaviour can be also set globally in ergonomics.
After receiving the response (the request is synchronous) we decrement the number of failed attempts by 1 using the addToInt step with shorthand syntax. We have used the addToInt action in the previous example: all actions can be used as steps, though steps (such as httpRequest) cannot be used as an action. This is not possible because a step can block sequence execution (waiting for an available connection, or until a variable is set…) but an action runs and completes without any delay - this is the main difference between those.
The last step is the nextSequence step (similar to the newSequence action) creating a new instance of the wrongLogin sequence. This step can be used anywhere in a sequence if it creates a different sequence or the sequence has sufficient concurrency limit (we had that fetchImage[10] in the previous example) - however had we added another step after it we would need two instances of wrongLogin running concurrently and the sequence is not marked as concurrent. When we place this as the last step there is a special case when the step only restarts current sequence, not requiring additional concurrent instance.
The successfulLogin sequence does not require much comment, it issues the same request as wrongSequence, only correctly picking the password from session variable. Let’s have a look on the results:
PHASE  METRIC           THROUGHPUT   REQUESTS  MEAN     p50      p90       p99       p99.9     p99.99    2xx  3xx  4xx  5xx  CACHE  TIMEOUTS  ERRORS  BLOCKED
main   fetchIndex       10.00 req/s       100  2.74 ms  3.01 ms   4.08 ms   4.85 ms   4.85 ms   4.85 ms  100    0    0    0      0         0       0     0 ns
main   successfulLogin  10.00 req/s       100  7.75 ms  8.32 ms  10.49 ms  11.53 ms  11.67 ms  11.67 ms  100    0    0    0      0         0       0     0 ns
main   wrongLogin        9.30 req/s        93  4.16 ms  4.98 ms   5.83 ms   6.98 ms   6.98 ms   6.98 ms    0    0   93    0      0         0       0     0 ns
We can now see 2xx responses for successfulLogin and 4xx responses for wrongLogin as we expect. Also the response times for a successful login are somewhat higher, maybe because the server stores a new token in the database.
Looking at browser network log we can see that the web-page captures this token and fetches user profile using that (it will also use this token in the Authorization header when talking to other services). Let’s add this to our test, and one more thing: while Hyperfoil can send another login request almost immediately your users would need some time to type these. Therefore we are going to add some user think time:
name: login
http:
# Frontend
- host: http://localhost:8080
  sharedConnections: 10
# User service
- host: http://localhost:8083
  sharedConnections: 10
duration: 10s
usersPerSec: 10
scenario:
  orderedSequences:
  - fetchIndex:
    - httpRequest:
        GET: /
        authority: localhost:8080
    - randomInt:
        min: 0
        max: 2
        toVar: failedAttempts
    - randomCsvRow:
        file: /tmp/credentials.csv
        removeQuotes: true
        columns:
          0: username
          1: password
    - thinkTime: 2s
  - wrongLogin:
    - breakSequence:
        intCondition:
          fromVar: failedAttempts
          equalTo: 0
        onBreak:
        - newSequence: successfulLogin
    - httpRequest:
        POST: /login
        authority: localhost:8083
        body:
          form:
          - name: username
            fromVar: username
          - name: password
            value: th1sIsMy$EcretPa55W%rD
        handler:
          autoRangeCheck: false
    - addToInt: failedAttempts--
    - thinkTime:
        duration: 2s
        random: NEGATIVE_EXPONENTIAL
        min: 500 ms
        max: 10s
    - nextSequence: wrongLogin
  sequences:
  - successfulLogin:
    - httpRequest:
        POST: /login
        authority: localhost:8083
        body:
          form:
          - name: username
            fromVar: username
          - name: password
            fromVar: password
        handler:
          body:
            store: token
    - nextSequence: fetchProfile
  - fetchProfile:
    - httpRequest:
        GET: /info?token=${urlencode:token}
        authority: localhost:8083
We have added constant 2-second pause as the last step of fetchIndex, and another pause into wrongLogin using negative-exponential distribution with expected average of 2 seconds but ranging from 500 ms to 10 seconds (the actual average will be about 2044 ms due to these limits).
Then we have added a simple body handler to the successful login request, storing the value in session variable token, and a nextSequence step to the successfulLogin sequence that will start the fetchProfile sequence with single httpRequest. You can notice that we had to use a new notation in the pattern: ${urlencode:token}. While pasting numbers into the request path is fine, a token might contain special symbols (such as +), and we need to URL-encode those. Contrary to the form used in the successfulLogin Hyperfoil cannot run the encoding automatically for you since it can’t know if the session variable contents is already URL-encoded (e.g. if you fetched an existing URL into that).
Let’s run this and see the output of stats command:
PHASE  METRIC           THROUGHPUT  REQUESTS  MEAN      p50       p90       p99       p99.9     p99.99    2xx  3xx  4xx  5xx  CACHE  TIMEOUTS  ERRORS  BLOCKED
main   fetchIndex       1.59 req/s        35   4.24 ms   3.54 ms   5.73 ms  13.83 ms  13.83 ms  13.83 ms   35    0    0    0      0         0       0     0 ns
main   fetchProfile     1.59 req/s        35   5.15 ms   4.69 ms   6.52 ms  22.68 ms  22.68 ms  22.68 ms   35    0    0    0      0         0       0     0 ns
main   successfulLogin  1.59 req/s        35  11.11 ms  10.75 ms  14.81 ms  36.96 ms  36.96 ms  36.96 ms   35    0    0    0      0         0       0     0 ns
main   wrongLogin       1.27 req/s        28   5.27 ms   5.44 ms   6.95 ms   7.44 ms   7.44 ms   7.44 ms    0    0   28    0      0         0       0     0 ns

main/fetchIndex: Exceeded session limit
main/fetchProfile: Exceeded session limit
main/successfulLogin: Exceeded session limit
main/wrongLogin: Exceeded session limit
In a colorful CLI you’d see all the lines in red and some errors listed below: “Exceeded session limit”, and we did not run all the ~100 index page hits. What happened?
Hyperfoil has a fixed limit for concurrency - number of virtual users (sessions) executed in parallel. By default this limit is equal to user arrival rate (usersPerSec), so in this scenario it was 10 concurrent users. However as with all those think-times the session takes several seconds, we will require more than 10 concurrent sessions, even if the virtual users are idle in their think-time. Average session should take 4 seconds pausing plus some time for the requests, so we can expect little over 40 concurrent users. We’ll add some margin and raise the limit to 60 sessions using the maxSessions property:
name: login
http:
- host: http://localhost:8080
  sharedConnections: 10
- host: http://localhost:8083
  sharedConnections: 10
duration: 10s
usersPerSec: 10
maxSessions: 60
scenario: # ...
After running this we’ll take a look on stats:
PHASE  METRIC           THROUGHPUT  REQUESTS  MEAN     p50      p90       p99       p99.9     p99.99    2xx  3xx  4xx  5xx  CACHE  TIMEOUTS  ERRORS  BLOCKED
main   fetchIndex       4.46 req/s       106  2.58 ms  2.56 ms   3.88 ms   6.46 ms  10.03 ms  10.03 ms  106    0    0    0      0         0       0     0 ns
main   fetchProfile     4.46 req/s       106  3.44 ms  3.52 ms   4.46 ms   7.01 ms   9.90 ms   9.90 ms  106    0    0    0      0         0       0     0 ns
main   successfulLogin  4.46 req/s       106  8.47 ms  8.36 ms  11.40 ms  15.07 ms  28.70 ms  28.70 ms  106    0    0    0      0         0       0     0 ns
main   wrongLogin       4.92 req/s       117  4.12 ms  4.33 ms   4.98 ms  14.48 ms  28.70 ms  28.70 ms    0    0  117    0      0         0       0     0 ns
There are no errors and the request numbers are as expected. The throughput is somewhat off because the total duration of the phase was several seconds past - Hyperfoil starts the sessions within the configured 10 seconds, then the phase moves to a FINISHED state but it won’t complete (state TERMINATED) until all sessions don’t execute its last step and receive response for the last request.
We can also take a look on number of sessions running concurrently using the sessions command in the CLI:
[hyperfoil@in-vm]$ sessions
Run 003E has terminated.
PHASE  AGENT  MIN  MAX
main   in-vm    1   53
Our guess that we’ll need 60 concurrent sessions was not too far off as at one moment we had 53 sessions running concurrently. You can also run this command when the test is being executed to see actual number of sessions rather than grand total for the whole phase.
This concludes our second blog post with a deep dive into complex scenarios. In the next article we’ll go through setting Hyperfoil up in an OpenShift cluster.
Beginner's Guide to Hyperfoil: part 1
TLDR
You’ll learn how to write a simple Hyperfoil benchmark and run it straight from the CLI.
This article is intended to be published on other sites, too - therefore it contains introduction to concepts this blog’s readers are probably familiar with.
Introduction
Meet Hyperfoil, a swiss-army knife of web benchmark driver. This is an opensource (ASL2.0) tool that sports a set of properties that we could not find in any of the existing load drivers:
- Do it the right way: Many tools use a closed model for driving the load - they spawn a fixed set of threads and fire synchronous requests, delaying further requests until the responses to previous ones arrive. While this is quite useful for quick tests, when you are only interested in the maximum throughput (and Hyperfoil supports this mode, too), applying feedback from the server does not simulate what latencies would users actually observe - closed model is subject to a coordinated omission problem. Hyperfoil is designed with open model in mind, requests are executed asynchronously and independently of the responses from the tested system.
- Drive the load as far as you need: Production systems often span whole clusters and you often can’t drive up system utilization using a single load generator. With Hyperfoil you don’t need to hack bash scripts to start the benchmark concurrently on several machines and then combine the results in a spreadsheet - Hyperfoil is distributed by design.
- Don’t oversimplify: In order to anticipate the behaviour when your users come the benchmark should do what do users would do. Hyperfoil is not limited to hitting a fixed set of URLs; you can describe complex logic in a YAML syntax, and if this is insufficient or too cumbersome you can extend it in good ol’ Java.
- Opensource: There are lies, damned lies, and benchmarks. When we publish results we want everyone to be able to reproduce them, or prove us wrong. Having the tool publicly available is certainly a step towards that goal.
Demo workload
In this series of blogposts we’ll use Vehicle Market, a demo application using several microservices to run a used-car bazaar. You’ll need either docker and docker-compose or podman and podman-compose installed to get it running.
So let’s start by spinning up the Vehicle Market:
curl -L http://vehicle-market.hyperfoil.io > /tmp/vehicle-market.yaml
podman-compose -f /tmp/vehicle-market.yaml -p vehicle-market up -d
Now you can go to http://localhost:8080 and browse through the application.
First benchmark
In this first post we’ll create a simple benchmark that does not realistically simulate a user, hitting different pages independently. Let’s create a new directory, e.g. $HOME/vehicle-market/benchmarks to host our benchmarks there.
# VMB stands for Vehicle Market Benchmarks
export VMB=$HOME/vehicle-market/benchmarks
mkdir -p $VMB
cd $VMB
# Temporary directory for the reports
mkdir /tmp/reports
Open a new file in your favourite editor (Visual Studio Code would be a good choice) and create your first benchmark, saving it as first-benchmark.hf.yaml:
name: first-benchmark
http:
  host: http://localhost:8080
  sharedConnections: 10
duration: 10s
usersPerSec: 10
scenario:
- fetchIndex:
  - httpRequest:
      GET: /
This benchmark is going create 10 connections (sharedConnections property) to http://localhost:8080 and during 10 seconds (duration property) run the scenario 10 times per second in average (usersPerSec property). By default the in-VM agent (load generator) is single-threaded; the property is called shared connections because if you increase the thread count or run the benchmark in a distributed setup using multiple agents there will be still 10 connections to the tested system, evenly distributed among agents and threads.
Hyperfoil does not operate with the notion of requests per second but with (virtual) users per second. Our scenario is the most trivial one, only firing single GET request to the root path (/) and therefore the number of requests equals to number of virtual users (also called user sessions).
We haven’t commented yet on fetchIndex. The scenario consists of one or more reusable sequences, each comprised of one or more steps. In our example fetchIndex is the name of the sequence, and there’s a single step: httpRequest (this can have many properties, GET selecting both the method and path being one of them).
Get it running
Now we have our benchmark defined we need to get Hyperfoil running. In future posts we’ll show how to run Hyperfoil truly distributed on Openshift (it’s possible to run it distributed on bare metal, too) but for now we’ll just open the CLI in a container and start it all in-process:
podman run -it --rm -v $VMB:/benchmarks:Z -v /tmp/reports:/tmp/reports:Z --network=host quay.io/hyperfoil/hyperfoil cli
In the command above we are mounting the benchmarks directory into /benchmarks in the container and writable /tmp/reports to the same path for a report later on. We are also using host network - by default the container would have its own network and localhost:8080 could not reach Vehicle Market.
In the CLI type start-local (tab completion works) to start Hyperfoil controller in the same VM, and then we can upload the benchmark (using upload) and start it with run:
[hyperfoil]$ start-local
Starting controller in default directory (/tmp/hyperfoil)
Controller started, listening on 127.0.0.1:45295
Connecting to the controller...
Connected!

[hyperfoil@in-vm]$ upload /benchmarks/first-benchmark.hf.yaml
Loaded benchmark first-benchmark, uploading...
... done.

[hyperfoil@in-vm]$ run first-benchmark
Started run 0000
Run 0000, benchmark first-benchmark
Agents: in-vm[STOPPED]
Started: 2021/01/25 17:00:31.869    Terminated: 2021/01/25 17:00:41.881$
NAME  STATUS      STARTED       REMAINING  COMPLETED     TOTAL DURATION                DESCRIPTION
main  TERMINATED  17:00:31.869             17:00:41.880  10011 ms (exceeded by 11 ms)  10.00 users per second
The benchmark successfully finished, it’s time to check on the results. CLI lets you display a simplified table of results using command stats; you can get all the gory details in a JSON-formatted file using export.
[hyperfoil@in-vm]$ stats
Total stats from run 0000
PHASE  METRIC       THROUGHPUT   REQUESTS  MEAN     p50      p90      p99      p99.9     p99.99    2xx  3xx  4xx  5xx  CACHE  TIMEOUTS  ERRORS  BLOCKED
main   fetchIndex  10.60 req/s       106  5.23 ms  5.08 ms  6.91 ms  9.96 ms  10.62 ms  10.62 ms  106    0    0    0      0         0       0     0 ns
You might be concerned at first by seeing 106 requests instead of 100 here; that’s by design, though. Hyperfoil does not execute the requests precisely every 100 ms because that’s not what the users would do; the incoming users are randomized using Poisson point process.
Exploring the JSON from export might not be the most convenient way, but there’s a third option: report command creates a fancy HTML report. Were you not running in a container a browser window with this report would be opened, too.
[hyperfoil@in-vm]$ report --destination=/tmp/reports
Written to /tmp/reports/0000.html
The front page shows only one rather wide column as we’ve used only one phase, but when you switch to details in the top navbar you can see the progression of requests:
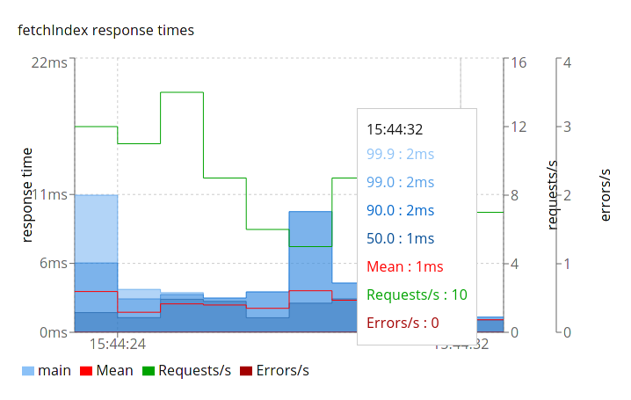
Report details example
Set phasers to kill
Allright, you could easily run a similar benchmark using other tools. Let’s add a different type of request into the mix. For that, we will need to introduce you to the concept of phases. In Hyperfoil, phases are (by default) independent workloads. We’ve already seen a main phase being reported in the statistics listing; the previous benchmark used a simplified single-constant-rate-phase syntax. When adding second phase we need to use the ‘full’ syntax:
name: first-benchmark
http:
  host: http://localhost:8080
  sharedConnections: 10
phases:
- listVehicles:
    constantRate:
      usersPerSec: 10
      duration: 10s
      scenario:
      - fetchIndex:
        - httpRequest:
            GET: /
- seeDetails:
    constantRate:
      usersPerSec: 10
      duration: 10s
      scenario:
      - fetchDetails:
        - httpRequest:
            GET: /offering/1
When you upload and run the benchmark you can see that both phases are running in parallel. Now try to schedule them one after another: In CLI, type edit first-benchmark and in the editor (vim) go to the seeDetails phase and add startAfter: listVehicles property to the phase. Save the file and quit the editor using the usual :wq.
- seeDetails:
    constantRate:
      startAfter: listVehicles
      usersPerSec: 10
#     ...
Run the benchmark again and see that this time the phases executed one after another (check the start and completion timestamps):
NAME          STATUS      STARTED       REMAINING  COMPLETED     TOTAL DURATION               DESCRIPTION
listVehicles  TERMINATED  10:10:12.650             10:10:22.654  10004 ms (exceeded by 4 ms)  10.00 users per second
seeDetails    TERMINATED  10:10:22.652             10:10:32.654  10002 ms (exceeded by 2 ms)  10.00 users per second
Note that edit does not modify the file in /benchmarks/; Hyperfoil controller stores benchmark definitions and you are updating the benchmark there (CLI automatically downloads it and re-uploads when the editor is closed).
Forks
The benchmark above was somewhat too verbose as the two phases (running in parallel) used the same setup. For those that don’t like to repeat themselves there’s an alternative way to execute two different scenarios: forks
name: first-benchmark
http:
  host: http://localhost:8080
  sharedConnections: 10
phases:
- main:
    constantRate:
      usersPerSec: 30
      duration: 10s
      forks:
      - listVehicles:
          weight: 2
          scenario:
          - fetchIndex:
            - httpRequest:
                GET: /
      - seeDetails:
          weight: 1
          scenario:
          - fetchDetails:
            - httpRequest:
                GET: /offering/1
Notice that we’ve increased the usersPerSec rate from 10 to 30. The user arrival rate is then distributed according to the weight of the fork, therefore listVehicles got 20 users/s and seeDetails got 10:
PHASE              METRIC        THROUGHPUT   REQUESTS  MEAN     p50      p90      p99      p99.9    p99.99   2xx  3xx  4xx  5xx  CACHE  TIMEOUTS  ERRORS  BLOCKED
main/listVehicles  fetchIndex    19.40 req/s       194  2.11 ms  2.16 ms  2.39 ms  3.65 ms  3.87 ms  3.87 ms  194    0    0    0      0         0       0     0 ns
main/seeDetails    fetchDetails  11.00 req/s       110  3.45 ms  3.47 ms  3.72 ms  4.82 ms  5.64 ms  5.64 ms  110    0    0    0      0         0       0     0 ns
Internally we’ve created two phases (actually there’s one more, see more about phases) and named them main/listVehicles and main/seeDetails.
The benchmark above does not have any warm-up nor ramp-up. Let’s add one, as a phase. However, we don’t want to repeat ourselves copypasting the scenarios or forks. Let’s use YAML anchors for that:
name: first-benchmark
http:
  host: http://localhost:8080
  sharedConnections: 10
phases:
- main:
    constantRate:
      startAfter: rampup
      usersPerSec: 30
      duration: 10s
      forks:
      - listVehicles: &listVehicles
          weight: 2
          scenario:
          - fetchIndex:
            - httpRequest:
                GET: /
      - seeDetails: &seeDetails
          weight: 1
          scenario:
          - fetchDetails:
            - httpRequest:
                GET: /offering/1
- rampup:
    increasingRate:
      initialUsersPerSec: 3
      targetUsersPerSec: 30
      duration: 10s
      forks:
      - listVehicles: *listVehicles
      - seeDetails: *seeDetails
We have marked each fork with an unique identifier (listVehicle and seeDetails) (the anchor matches to the fork name but that’s not a requirement) using & anchor. Then we have added the rampup phase that gradually increases the load from 3 to 30 users per second and reused the definitions using alias *. This is a standard YAML feature and your editor should understand it; Hyperfoil interprets it by cloning the definition of the fork. You can use this at multiple levels: for forks, scenarios or sequences.
Building the scenario
There’s more to phases and we suggest going through the quickstarts, but let’s move to another topic: the scenarios themselves. So far we’ve been hitting only two static resources, the root and one offering. Let’s get back to the very first example and add some randomization:
name: first-benchmark
http:
  host: http://localhost:8080
  sharedConnections: 10
duration: 10s
usersPerSec: 10
scenario:
- fetchDetails:
  - randomInt:
      min: 1
      max: 100
      toVar: offering
  - httpRequest:
      GET: /offering/${offering}
We have extended the fetchDetails sequence to two steps. In the first step randomInt we generate a random integer between 1 and 100 (inclusive) and store that in the user session under the key offering. Each virtual user has its own session that defines the state of the scenario and keeps all the session variables. Consider using initialSequences to ensure session variables are populated. In the second step httpRequest we specify the path for a GET request using a template interpolating ${offering} into the value of the variable.
If you execute the request using web browser with a network monitor you’ll find out that it’s not just the document located at http://localhost:8080/offering/1 it is fetching. There’s also images, scripts and CSS. Hyperfoil offers an easy-to-use option to download resources fetched from the HTML page:
name: first-benchmark
http:
  host: http://localhost:8080
  sharedConnections: 10
duration: 10s
usersPerSec: 10
scenario:
- fetchDetails:
  - randomInt:
      min: 1
      max: 100
      toVar: offering
  - httpRequest:
      GET: /offering/${offering}
      handler:
        body:
          parseHtml:
            onEmbeddedResource:
              fetchResource:
                maxResources: 16
After uploading and running this you can check out stats:
[hyperfoil@in-vm]$ stats
Total stats from run 0024
PHASE  METRIC                               THROUGHPUT   REQUESTS  MEAN      p50       p90       p99       p99.9     p99.99    2xx  3xx  4xx  5xx  CACHE  TIMEOUTS  ERRORS  BLOCKED
main   /config                              12.20 req/s       122  14.64 ms  12.19 ms  34.08 ms  41.68 ms  50.07 ms  50.07 ms  122    0    0    0      0         0       0       0 ns
main   /favicon.ico                         12.20 req/s       122   9.70 ms   5.21 ms  19.53 ms  29.75 ms  37.75 ms  37.75 ms  122    0    0    0      0         0       0       0 ns
main   /manifest.json                       12.20 req/s       122   7.39 ms   4.39 ms  15.73 ms  27.39 ms  34.87 ms  34.87 ms  122    0    0    0      0         0       0       0 ns
main   /static/css/2.0720d3cf.chunk.css     12.20 req/s       122  18.27 ms  12.32 ms  33.82 ms  40.37 ms  41.42 ms  41.42 ms  122    0    0    0      0         0       0  139.48 ms
main   /static/css/main.7fcb1519.chunk.css  12.20 req/s       122  17.04 ms  11.99 ms  33.82 ms  38.54 ms  40.11 ms  40.11 ms  122    0    0    0      0         0       0  149.66 ms
main   /static/js/2.256a11d3.chunk.js       12.20 req/s       122  25.66 ms  19.66 ms  43.25 ms  50.07 ms  67.11 ms  67.11 ms  122    0    0    0      0         0       0  148.54 ms
main   /static/js/main.656b4a9d.chunk.js    12.20 req/s       122  24.93 ms  20.05 ms  42.99 ms  51.64 ms  66.85 ms  66.85 ms  122    0    0    0      0         0       0  121.88 ms
main   fetchDetails                         12.20 req/s       122   5.41 ms   2.06 ms  10.68 ms  41.68 ms  41.68 ms  41.68 ms  122    0    0    0      0         0       0       0 ns

main//static/css/2.0720d3cf.chunk.css: Progress was blocked waiting for a free connection. Hint: increase http.sharedConnections.
main//static/css/main.7fcb1519.chunk.css: Progress was blocked waiting for a free connection. Hint: increase http.sharedConnections.
main//static/js/2.256a11d3.chunk.js: Progress was blocked waiting for a free connection. Hint: increase http.sharedConnections.
main//static/js/main.656b4a9d.chunk.js: Progress was blocked waiting for a free connection. Hint: increase http.sharedConnections.
When running this in CLI you’d see that four of these metrics would be printed in red color and have a non-zero number in the BLOCKED column. This is happening because with more HTTP requests being sent, it’s quite likely that one user starts before a previous user has received all the responses.
With HTTP 1.1 (pipelining disabled by default) and only 10 connections there would not be enough available connections and the virtual user couldn’t send the request right away. This wouldn’t happen to a real user - that one is not limited by other users. Had we allowed a feedback from the server (taking few moments to respond) our latency readings could be dramatically skewed. This is why Hyperfoil warns us that the benchmark wasn’t 100% correct and hints us to increase number of connections.
Alternatively we could switch to HTTP 2 that supports multiplexing several requests over single connection.
To be continued…
Comparing the requests to a browser’s network monitor we’ve omitted the call to http://localhost:8082/offering/${offering} (executed from script) and loading images from http://localhost:8080/images/car?.... We will cover that in the next part.
Compensation for coordinated omission
Results for closed-model tests show maximum throughput your SUT can achieve; the response times are skewed though due to the coordinated omission. There are still cases where you’d like to run in this mode and check the size of the error you’re accumulating.
Many benchmarks use closed-model with fixed concurrency and cycle-time, expecting the request to be fired every X milliseconds. When the requests fall behind in schedule due to some requests taking more than this period (cycle-time) the subsequent requests are fired as quickly as possible to catch up. The ‘compensated’ results estimate what would the latency be if you fired the requests on time. With open model the actual latencies could be the same (assuming that the previous request was delayed due waiting in a queue on server), better (the response was incidentally delayed on the network) or worse (the server queue would perform worse if hosting more requests).
Hyperfoil will tell you both values - the actually observed latencies AND the compensated estimate of latencies. You can use this mode only in always phases where you fix the cycle-time by providing a target rate of starting user sessions (contrary to the regular always behaviour starting user sessions as soon as possible). Note that the compensated time will be correct only if you don’t execute any blocking steps before firing the request(s).
Example:
name: test
http:
- host: http://example.com
  sharedConnections: 2
phases:
- test:
    always:
      users: 10
      duration: 20s
      scenario:
      - test:
        - httpRequest:
            GET: /
            compensation:
              targetRate: 10
The test above uses 10 concurrent users and tries to run at 10 requests/s. Below you can see CLI listing from the stats command, showing mean response time of 113 ms (real) vs. 172 ms (compensated). In this case the difference is not caused by a responses taking more than 1 second (the cycle-time for each user) but because sending the request is blocked by lack of available connections (we are using only 2): see that the BLOCKED column says that requests have been blocked for more than 6 seconds waiting for a free connection.
[hyperfoil@in-vm]$ stats
Total stats from run 0025
PHASE  METRIC            THROUGHPUT  REQUESTS  MEAN       p50        p90        p99        p99.9      p99.99     2xx  3xx  4xx  5xx  CACHE  TIMEOUTS  ERRORS  BLOCKED
test   compensated-test  9.97 req/s       208  171.78 ms  148.90 ms  216.01 ms  641.73 ms  968.88 ms  968.88 ms    0    0    0    0      0         0       0     0 ns
test   test              9.97 req/s       208  113.42 ms  103.28 ms  149.95 ms  312.48 ms  392.17 ms  392.17 ms  208    0    0    0      0         0       0  6.23 s
What happens underhood? You can see that using the inspect command in the CLI (some parts removed for brevity):
scenario:
  initialSequences:
  - __delay-session-start:
    - delaySessionStart:
        randomize: true
        sequences:
        - test
        targetRate: 10.0
        targetRateIncrement: 0.0
  sequences:
  - test:
    - beforeSyncRequest: {}
    - httpRequest:
        handler:
        completionHandlers:
        - releaseSync: {}
        - compensatedResponseRecorder:
            metricSelector:
              prefixMetricSelector:
              delegate:
                providedMetricSelector:
                  name: test
              prefix: compensated-
            stepId: 21
        ...
The sequence test is removed from the initialSequences set and sequence __delay-session-start takes place instead. This contains single step delaySessionStart that waits until its due and then schedules the sequence test. The compensated time is recorded by another handler that reuses the metric selector from the request but adds compensated- prefix.
Fetch embedded resources
When browsing a website it’s not only the main page the webserver needs to serve - usually there are static resources such as images, stylesheets, scripts and more. Hyperfoil can automatically download these.
Hyperfoil implements a non-allocating HTML parser, with a pre-baked onEmbeddedResource handler: This selects HTML tags with appropriate attributes that represent an URL:
- Images:
<img src="..."> - Stylesheets:
<link href="..."> - Scripts:
<script src="..."> - Embedded media:
<embed src="...">,<object data="..."> - Frames:
<frame src="...">,<iframe src="...">
The other part of the solution is executing a GET request at given URL. Modern browsers don’t download the resources one-by-one, nor do they fetch them all at once - usually these download around 6-8 resources in parallel. In Hyperfoil this is implemented by adding the URL to a queue. The queue delivers each URL to a new instance of a sequence (automatically generated) that fires the HTTP request, and limits the number of these sequences.
Since Hyperfoil pre-allocates all data structures ahead, you need to declare a limit on number of resources that can be fetched. If the queue cannot store more than maxResources URLs it simply discards the other URLs, emitting a warning to the log.
The parser signals the queue when there’s no more data on the producing side, and when all of them are consumed the queue can fire some extra action. Note that completion of the original request does not wait until all the resources are fetched.
Below is an example of a configuration fetching embedded resources:
- fetching:
  - httpRequest:
      GET: /foobar/index.html
      handler:
        body:
          parseHtml:
            onEmbeddedResource:
              fetchResource:
                maxResources: 16
                metric:
                # Drop the query part
                - ([^?]*)(\?.*)? -> $1
                onCompletion:
                  set: allFetched <- true
For details please see the reference.
Automatic follow of redirects
Hyperfoil is trying to imitate how users will hit your site with requests as realistically as possible. Therefore it supports one of the browser features: redirections.
There are two ways how webservers tell browsers where to fetch another page: HTTP-level redirects where the server returns status 3xx and the new URL in the Location header, and HTML with <meta http-equiv="refresh" content="5; url=http://example.com" />. The webpage can also use Javascript to switch to another page but Hyperfoil is not interpretting any Javascript.
You could implement the location-based redirect in YAML straight away:
- redirectMe:
  - unset: location
  - httpRequest:
      GET: /redirectMe
      metric: first_request
      handler:
        header:
          filter:
            header:
              value: location
            processor:
              store: location
  - httpRequest:
      GET:
        fromVar: location
      metric: second_request
This would work in simple cases but it comes with several down-sides:
- You assume that the
/redirectMealways responds with redirecting status. If the server can respond with other status you need to check its value and fence any handlers with sentinel based on status+location presence. - Even with extra conditions the presented approach would not work if there is a series of redirections.
- If you want to apply the same data (headers, body…) or handlers to both requests, you’d need to copy-paste them.
- If you’re issuing a
POSTinstead ofGETrequest some status values require that the second request is aGET. - If the redirection URL is a relative one you’d need to compose the final URL yourselves.
- If there’s a chance that the sequence is insantiated multiple times concurrently you’d need to transform
locationto a sequence-scoped variable.
Coding a general solution in YAML would be cumbersome, but you don’t need to do that - all you need is:
- redirectMe:
  - httpRequest:
      GET: /redirectMe
    handler:
      followRedirect: ALWAYS
Underhood this simple option adds/rewraps all the handlers (not presented in the example) as needed. If the response has a non-3xx status and there’s no refresh <meta /> tag everything is applied as usual. When the response suggests a redirect the request is executed in a new sequence. The request uses the same headers and body as the original request (evaluating the handlers second time, though) and all the original handlers are applied to the response. That includes handlers inserted through other ‘magic’ options, e.g. the sync option: if the original request was marked as synchronous the original sequence won’t continue until the series of redirections ends with a non-redirecting request.
You might also want to react only to HTTP-level redirections (use followRedirect: LOCATION_ONLY) or the <meta /> tag (use followRedirect: HTML_ONLY); the subsequent requests in the redirect chain will keep the same policy. The default value for the redirect is NEVER - both because of the principle of least surprise, to reduce memory footprint of the session and not complicate the debugging when redirects are not needed. If you prefer to keep the same policy for all requests in the benchmark you can change the default in the ergonomics section.
Note that while location-based redirect suppresses execution of all status-, headers- and body-handlers the HTML-redirect option (HTML redirect) runs all of them as usual even on the body part that does the redirect. Also, HTML-redirect supports the refresh timeout (load the page after X seconds) - this case warrants another generated sequence where the request is waiting to be executed.