Beginner's Guide to Hyperfoil: part 1
TLDR
You’ll learn how to write a simple Hyperfoil benchmark and run it straight from the CLI.
This article is intended to be published on other sites, too - therefore it contains introduction to concepts this blog’s readers are probably familiar with.
Introduction
Meet Hyperfoil, a swiss-army knife of web benchmark driver. This is an opensource (ASL2.0) tool that sports a set of properties that we could not find in any of the existing load drivers:
- Do it the right way: Many tools use a closed model for driving the load - they spawn a fixed set of threads and fire synchronous requests, delaying further requests until the responses to previous ones arrive. While this is quite useful for quick tests, when you are only interested in the maximum throughput (and Hyperfoil supports this mode, too), applying feedback from the server does not simulate what latencies would users actually observe - closed model is subject to a coordinated omission problem. Hyperfoil is designed with open model in mind, requests are executed asynchronously and independently of the responses from the tested system.
- Drive the load as far as you need: Production systems often span whole clusters and you often can’t drive up system utilization using a single load generator. With Hyperfoil you don’t need to hack bash scripts to start the benchmark concurrently on several machines and then combine the results in a spreadsheet - Hyperfoil is distributed by design.
- Don’t oversimplify: In order to anticipate the behaviour when your users come the benchmark should do what do users would do. Hyperfoil is not limited to hitting a fixed set of URLs; you can describe complex logic in a YAML syntax, and if this is insufficient or too cumbersome you can extend it in good ol’ Java.
- Opensource: There are lies, damned lies, and benchmarks. When we publish results we want everyone to be able to reproduce them, or prove us wrong. Having the tool publicly available is certainly a step towards that goal.
Demo workload
In this series of blogposts we’ll use Vehicle Market, a demo application using several microservices to run a used-car bazaar. You’ll need either docker and docker-compose or podman and podman-compose installed to get it running.
So let’s start by spinning up the Vehicle Market:
curl -L http://vehicle-market.hyperfoil.io > /tmp/vehicle-market.yaml
podman-compose -f /tmp/vehicle-market.yaml -p vehicle-market up -d
Now you can go to http://localhost:8080 and browse through the application.
First benchmark
In this first post we’ll create a simple benchmark that does not realistically simulate a user, hitting different pages independently. Let’s create a new directory, e.g. $HOME/vehicle-market/benchmarks to host our benchmarks there.
# VMB stands for Vehicle Market Benchmarks
export VMB=$HOME/vehicle-market/benchmarks
mkdir -p $VMB
cd $VMB
# Temporary directory for the reports
mkdir /tmp/reports
Open a new file in your favourite editor (Visual Studio Code would be a good choice) and create your first benchmark, saving it as first-benchmark.hf.yaml:
name: first-benchmark
http:
  host: http://localhost:8080
  sharedConnections: 10
duration: 10s
usersPerSec: 10
scenario:
- fetchIndex:
  - httpRequest:
      GET: /
This benchmark is going create 10 connections to http://localhost:8080 and during 10 seconds run the scenario 10 times per second in average . By default the in-VM agent (load generator) is single-threaded; the property is called shared connections because if you increase the thread count or run the benchmark in a distributed setup using multiple agents there will be still 10 connections to the tested system, evenly distributed among agents and threads.
Hyperfoil does not operate with the notion of requests per second but with (virtual) users per second. Our scenario is the most trivial one, only firing single GET request to the root path (/) and therefore the number of requests equals to number of virtual users (also called user sessions).
We haven’t commented yet on fetchIndex . The scenario consists of one or more reusable sequences, each comprised of one or more steps. In our example fetchIndex is the name of the sequence, and there’s a single step: httpRequest (this can have many properties, GET selecting both the method and path being one of them).
Get it running
Now we have our benchmark defined we need to get Hyperfoil running. In future posts we’ll show how to run Hyperfoil truly distributed on Openshift (it’s possible to run it distributed on bare metal, too) but for now we’ll just open the CLI in a container and start it all in-process:
podman run -it --rm -v $VMB:/benchmarks:Z -v /tmp/reports:/tmp/reports:Z --network=host quay.io/hyperfoil/hyperfoil cli
In the command above we are mounting the benchmarks directory into /benchmarks in the container and writable /tmp/reports to the same path for a report later on. We are also using host network - by default the container would have its own network and localhost:8080 could not reach Vehicle Market.
In the CLI type start-local (tab completion works) to start Hyperfoil controller in the same VM, and then we can upload the benchmark (using upload) and start it with run:
[hyperfoil]$ start-local
Starting controller in default directory (/tmp/hyperfoil)
Controller started, listening on 127.0.0.1:45295
Connecting to the controller...
Connected!
[hyperfoil@in-vm]$ upload /benchmarks/first-benchmark.hf.yaml
Loaded benchmark first-benchmark, uploading...
... done.
[hyperfoil@in-vm]$ run first-benchmark
Started run 0000
Run 0000, benchmark first-benchmark
Agents: in-vm[STOPPED]
Started: 2021/01/25 17:00:31.869    Terminated: 2021/01/25 17:00:41.881$
NAME  STATUS      STARTED       REMAINING  COMPLETED     TOTAL DURATION                DESCRIPTION
main  TERMINATED  17:00:31.869             17:00:41.880  10011 ms (exceeded by 11 ms)  10.00 users per second
The benchmark successfully finished, it’s time to check on the results. CLI lets you display a simplified table of results using command stats; you can get all the gory details in a JSON-formatted file using export.
[hyperfoil@in-vm]$ stats
Total stats from run 0000
PHASE  METRIC       THROUGHPUT   REQUESTS  MEAN     p50      p90      p99      p99.9     p99.99    2xx  3xx  4xx  5xx  CACHE  TIMEOUTS  ERRORS  BLOCKED
main   fetchIndex  10.60 req/s       106  5.23 ms  5.08 ms  6.91 ms  9.96 ms  10.62 ms  10.62 ms  106    0    0    0      0         0       0     0 ns
You might be concerned at first by seeing 106 requests instead of 100 here; that’s by design, though. Hyperfoil does not execute the requests precisely every 100 ms because that’s not what the users would do; the incoming users are randomized using Poisson point process.
Exploring the JSON from export might not be the most convenient way, but there’s a third option: report command creates a fancy HTML report. Were you not running in a container a browser window with this report would be opened, too.
[hyperfoil@in-vm]$ report --destination=/tmp/reports
Written to /tmp/reports/0000.html
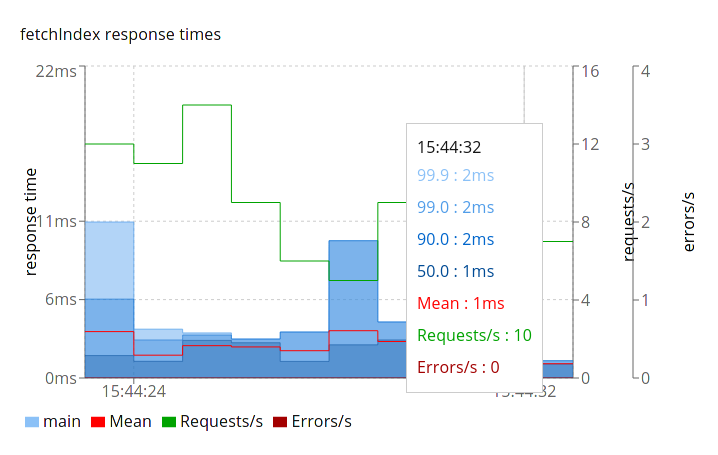
The front page shows only one rather wide column as we’ve used only one phase, but when you switch to details in the top navbar you can see the progression of requests:
Set phasers to kill
Allright, you could easily run a similar benchmark using other tools. Let’s add a different type of request into the mix. For that, we will need to introduce you to the concept of phases. In Hyperfoil, phases are (by default) independent workloads. We’ve already seen a main phase being reported in the statistics listing; the previous benchmark used a simplified single-constant-rate-phase syntax. When adding second phase we need to use the ‘full’ syntax:
name: first-benchmark
http:
  host: http://localhost:8080
  sharedConnections: 10
phases:
- listVehicles:
    constantRate:
      usersPerSec: 10
      duration: 10s
      scenario:
      - fetchIndex:
        - httpRequest:
            GET: /
- seeDetails:
    constantRate:
      usersPerSec: 10
      duration: 10s
      scenario:
      - fetchDetails:
        - httpRequest:
            GET: /offering/1
When you upload and run the benchmark you can see that both phases are running in parallel. Now try to schedule them one after another: In CLI, type edit first-benchmark and in the editor (vim) go to the seeDetails phase and add startAfter: listVehicles property to the phase. Save the file and quit the editor using the usual :wq.
- seeDetails:
    constantRate:
      startAfter: listVehicles
      usersPerSec: 10
#     ...
Run the benchmark again and see that this time the phases executed one after another (check the start and completion timestamps):
NAME          STATUS      STARTED       REMAINING  COMPLETED     TOTAL DURATION               DESCRIPTION
listVehicles  TERMINATED  10:10:12.650             10:10:22.654  10004 ms (exceeded by 4 ms)  10.00 users per second
seeDetails    TERMINATED  10:10:22.652             10:10:32.654  10002 ms (exceeded by 2 ms)  10.00 users per second
Note that edit does not modify the file in /benchmarks/; Hyperfoil controller stores benchmark definitions and you are updating the benchmark there (CLI automatically downloads it and re-uploads when the editor is closed).
Forks
The benchmark above was somewhat too verbose as the two phases (running in parallel) used the same setup. For those that don’t like to repeat themselves there’s an alternative way to execute two different scenarios: forks
name: first-benchmark
http:
  host: http://localhost:8080
  sharedConnections: 10
phases:
- main:
    constantRate:
      usersPerSec: 30
      duration: 10s
      forks:
      - listVehicles:
          weight: 2
          scenario:
          - fetchIndex:
            - httpRequest:
                GET: /
      - seeDetails:
          weight: 1
          scenario:
          - fetchDetails:
            - httpRequest:
                GET: /offering/1
Notice that we’ve increased the usersPerSec rate from 10 to 30 . The user arrival rate is then distributed according to the weight of the fork, therefore listVehicles got 20 users/s and seeDetails got 10:
PHASE              METRIC        THROUGHPUT   REQUESTS  MEAN     p50      p90      p99      p99.9    p99.99   2xx  3xx  4xx  5xx  CACHE  TIMEOUTS  ERRORS  BLOCKED
main/listVehicles  fetchIndex    19.40 req/s       194  2.11 ms  2.16 ms  2.39 ms  3.65 ms  3.87 ms  3.87 ms  194    0    0    0      0         0       0     0 ns
main/seeDetails    fetchDetails  11.00 req/s       110  3.45 ms  3.47 ms  3.72 ms  4.82 ms  5.64 ms  5.64 ms  110    0    0    0      0         0       0     0 ns
Internally we’ve created two phases (actually there’s one more, see more about phases) and named them main/listVehicles and main/seeDetails.
The benchmark above does not have any warm-up nor ramp-up. Let’s add one, as a phase. However, we don’t want to repeat ourselves copypasting the scenarios or forks. Let’s use YAML anchors for that:
name: first-benchmark
http:
  host: http://localhost:8080
  sharedConnections: 10
phases:
- main:
    constantRate:
      startAfter: rampup
      usersPerSec: 30
      duration: 10s
      forks:
      - listVehicles: &listVehicles
          weight: 2
          scenario:
          - fetchIndex:
            - httpRequest:
                GET: /
      - seeDetails: &seeDetails
          weight: 1
          scenario:
          - fetchDetails:
            - httpRequest:
                GET: /offering/1
- rampup:
    increasingRate:
      initialUsersPerSec: 3
      targetUsersPerSec: 30
      duration: 10s
      forks:
      - listVehicles: *listVehicles
      - seeDetails: *seeDetails
We have marked each fork with an unique identifier (the anchor matches to the fork name but that’s not a requirement) using & anchor. Then we have added the rampup phase that gradually increases the load from 3 to 30 users per second and reused the definitions using alias * . This is a standard YAML feature and your editor should understand it; Hyperfoil interprets it by cloning the definition of the fork. You can use this at multiple levels: for forks, scenarios or sequences.
Building the scenario
There’s more to phases and we suggest going through the quickstarts, but let’s move to another topic: the scenarios themselves. So far we’ve been hitting only two static resources, the root and one offering. Let’s get back to the very first example and add some randomization:
name: first-benchmark
http:
  host: http://localhost:8080
  sharedConnections: 10
duration: 10s
usersPerSec: 10
scenario:
- fetchDetails:
  - randomInt:
      min: 1
      max: 100
      toVar: offering
  - httpRequest:
      GET: /offering/${offering}
We have extended the fetchDetails sequence to two steps. In the first step randomInt we generate a random integer between 1 and 100 (inclusive) and store that in the user session under the key offering. Each virtual user has its own session that defines the state of the scenario and keeps all the session variables. Consider using initialSequences to ensure session variables are populated. In the second step httpRequest we specify the path for a GET request using a template interpolating ${offering} into the value of the variable.
If you execute the request using web browser with a network monitor you’ll find out that it’s not just the document located at http://localhost:8080/offering/1 it is fetching. There’s also images, scripts and CSS. Hyperfoil offers an easy-to-use option to download resources fetched from the HTML page:
name: first-benchmark
http:
  host: http://localhost:8080
  sharedConnections: 10
duration: 10s
usersPerSec: 10
scenario:
- fetchDetails:
  - randomInt:
      min: 1
      max: 100
      toVar: offering
  - httpRequest:
      GET: /offering/${offering}
      handler:
        body:
          parseHtml:
            onEmbeddedResource:
              fetchResource:
                maxResources: 16
After uploading and running this you can check out stats:
[hyperfoil@in-vm]$ stats
Total stats from run 0024
PHASE  METRIC                               THROUGHPUT   REQUESTS  MEAN      p50       p90       p99       p99.9     p99.99    2xx  3xx  4xx  5xx  CACHE  TIMEOUTS  ERRORS  BLOCKED
main   /config                              12.20 req/s       122  14.64 ms  12.19 ms  34.08 ms  41.68 ms  50.07 ms  50.07 ms  122    0    0    0      0         0       0       0 ns
main   /favicon.ico                         12.20 req/s       122   9.70 ms   5.21 ms  19.53 ms  29.75 ms  37.75 ms  37.75 ms  122    0    0    0      0         0       0       0 ns
main   /manifest.json                       12.20 req/s       122   7.39 ms   4.39 ms  15.73 ms  27.39 ms  34.87 ms  34.87 ms  122    0    0    0      0         0       0       0 ns
main   /static/css/2.0720d3cf.chunk.css     12.20 req/s       122  18.27 ms  12.32 ms  33.82 ms  40.37 ms  41.42 ms  41.42 ms  122    0    0    0      0         0       0  139.48 ms
main   /static/css/main.7fcb1519.chunk.css  12.20 req/s       122  17.04 ms  11.99 ms  33.82 ms  38.54 ms  40.11 ms  40.11 ms  122    0    0    0      0         0       0  149.66 ms
main   /static/js/2.256a11d3.chunk.js       12.20 req/s       122  25.66 ms  19.66 ms  43.25 ms  50.07 ms  67.11 ms  67.11 ms  122    0    0    0      0         0       0  148.54 ms
main   /static/js/main.656b4a9d.chunk.js    12.20 req/s       122  24.93 ms  20.05 ms  42.99 ms  51.64 ms  66.85 ms  66.85 ms  122    0    0    0      0         0       0  121.88 ms
main   fetchDetails                         12.20 req/s       122   5.41 ms   2.06 ms  10.68 ms  41.68 ms  41.68 ms  41.68 ms  122    0    0    0      0         0       0       0 ns

main//static/css/2.0720d3cf.chunk.css: Progress was blocked waiting for a free connection. Hint: increase http.sharedConnections.
main//static/css/main.7fcb1519.chunk.css: Progress was blocked waiting for a free connection. Hint: increase http.sharedConnections.
main//static/js/2.256a11d3.chunk.js: Progress was blocked waiting for a free connection. Hint: increase http.sharedConnections.
main//static/js/main.656b4a9d.chunk.js: Progress was blocked waiting for a free connection. Hint: increase http.sharedConnections.
When running this in CLI you’d see that four of these metrics would be printed in red color and have a non-zero number in the BLOCKED column. This is happening because with more HTTP requests being sent, it’s quite likely that one user starts before a previous user has received all the responses.
With HTTP 1.1 (pipelining disabled by default) and only 10 connections there would not be enough available connections and the virtual user couldn’t send the request right away. This wouldn’t happen to a real user - that one is not limited by other users. Had we allowed a feedback from the server (taking few moments to respond) our latency readings could be dramatically skewed. This is why Hyperfoil warns us that the benchmark wasn’t 100% correct and hints us to increase number of connections.
Alternatively we could switch to HTTP 2 that supports multiplexing several requests over single connection.
To be continued…
Comparing the requests to a browser’s network monitor we’ve omitted the call to http://localhost:8082/offering/${offering} (executed from script) and loading images from http://localhost:8080/images/car?.... We will cover that in the next part.